Earnio results for February 2025
1 month ago
Tomáš Hucík
Our market direction in February was set more towards the growth market. However, shortly after Donald Trump's inauguration, it became clear that it would not be that simple. Especially when tariffs and the threat of a recession once again become entangled. When the economic outlook for the market is unclear, risk assets that are both fast and liquid enough to be traded 24/7 (cryptocurrencies), whether it's a deep night or a weekend, take the hit first. They are like such a canary in the coal mine.
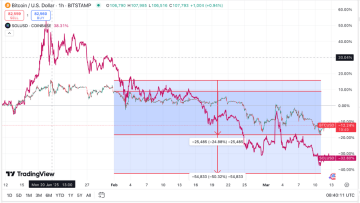
The first half of February was still relatively neutral, but in the second half the nervousness kicked in and the biggest drop came on the last day of February. Overall, bitcoin was down roughly -25% for February. Some altcoins more than doubled.

Bitcoin wrote off almost 25% in February, Solana wrote off even 50%. Source: tradingview.com
But our risk management worked well in this case, and although our algorithmic strategies took a loss, it was not nearly as bad as the bloodbath in the open market. Some strategies did open trades, but, as the market went against them, the stop-loss protection order was always correctly activated, and so there was only an accumulation of minor losses.
Earnio Dynamic thus closed one of the worst months in the markets with a loss of -6.87%.
For now, it can be said that we remain cautiously still with our bullish setup strategies, but we are watching the developments very closely and we are ready to switch the strategies to a more market neutral setup or even orient them more towards shorts.
At Earnio, we were also focused during February on finalizing the infrastructure that leads to the splitting of Earnio's portfolio into separate programs. The lucrative Earnio FIX for our first clients, which can no longer be entered, has been separated from Earnio Dynamic. What's more, Earnio Dynamic will be launching its second version.
In a few days indeed, my colleagues from Marketing will bring you the complete information. For now, I can tell you that you can look forward to a modified risk profile, higher percentages for clients and also systemic protection against negative balance.
Tariffs and Macro Conditions: A Risk-Off Backdrop
Zooming out, broader economic conditions dealt a heavy blow to crypto in February. The month vividly illustrated how macro news can whipsaw a hyper-reactive market. The catalyst that kicked off the early-February downturn was a political one: on the first weekend of the month, U.S. President Donald Trump announced new tariffs – 25% on imports from Canada and Mexico, and an additional 10% on Chinese goods.
This development immediately spooked investors worldwide. Trade tariffs tend to be seen as inflationary (they can raise prices of goods), and the fear was that such inflationary pressures would force central banks to stay hawkish. In other words, if tariffs started pushing prices up, the U.S. Federal Reserve would be less likely to cut interest rates – prolonging a high interest rate environment that generally makes risk assets like stocks and crypto less attractive. Crypto, being on the far end of the risk spectrum, reacted swiftly and negatively to the tariff news.
In summary, macro conditions in February were mostly unfriendly to crypto: a trade-policy shock, no help from central banks, and rising global uncertainty all made traders less eager to deploy capital into digital assets. Crypto, often touted as uncorrelated, showed once again that in the short term it’s deeply affected by traditional market fears.
BTC ETF flows
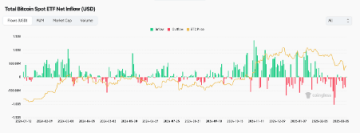
One of the most notable trends was the reversal of fortune for Bitcoin ETFs and other institutional products. After months of steady inflows, February saw heavy outflows from Bitcoin exchange-traded funds. In fact, during a six-day stretch late in the month, over $2.4 billion flowed out of U.S. spot Bitcoin ETFs, including a single-day record of about $937 million in withdrawals on Feb. 25 coinstats.app

Bitcoin ETF outflows that started in February are actually continuing until now. Source: https://www.coinglass.com/bitcoin-etf
Major funds like Fidelity’s and BlackRock’s Bitcoin trusts led the exodus, with hundreds of millions pulled from each.
This sudden drawdown in ETF holdings indicated that many institutional players hit the brakes on bitcoin exposure, likely locking in profits or cutting risk.
What’s the implication of these ETF outflows? For one, they exerted downward pressure on Bitcoin’s price, removing a source of buy-side demand. The outflows also signaled a cautious stance by big-money investors. Out of the 28 trading days in February, ETFs saw net inflows on only five days – underscoring how persistently money was being pulled out. While ETF investors tend to have longer horizons, even they weren’t immune to the month’s volatility. The retreat of institutional funds was both a symptom and a cause of Bitcoin’s price weakness, creating a feedback loop that amplified bearish sentiment.
Market Sentiment: Fear & Greed Index on a Rollercoaster
Investor sentiment in February swung from optimism to anxiety in dramatic fashion. At the start of the month, the market was coming off a period of “greed.” In fact, the Crypto Fear & Greed Index had remained above 70 (indicative of greed) through late January, reflecting positive sentiment after the new year rally. However, early February brought a swift change in tone. By mid-month, as prices started dropping, traders grew nervous – and by the final week of February, the Fear & Greed Index plunged into “extreme fear” territory.
One particularly jarring shift occurred on Feb. 25: the index fell from a neutral 49 down to around 25 in just one day, one of the sharpest sentiment drops in recent memory. A reading in the mid-20s signals extreme fear among investors. Essentially, confidence evaporated almost overnight.
By month’s end, anxiety and caution reigned, a stark contrast to the optimism seen only weeks prior. Experienced crypto folks know that such extreme fear can sometimes mark a contrarian buy zone – when everyone is scared, markets may be near a bottom – but it certainly didn’t feel like a buying opportunity to many at the time. The prevailing mood was defensive: better to preserve capital than to be a hero catching falling knives.

Source: https://alternative.me/crypto/fear-and-greed-index/
If you look at the current situation, the index is starting to slowly pick up, but it is important to note that it is volatility worthy.
Technical Analysis: Key Levels, Moving Averages, and RSI Signals
From a technical standpoint, February’s price action put Bitcoin on the back foot. The month began with Bitcoin near the $100K level it had recently flirted with, but an inability to break higher set the stage for a pullback. Once the sell-off picked up steam, several key support levels came into play.
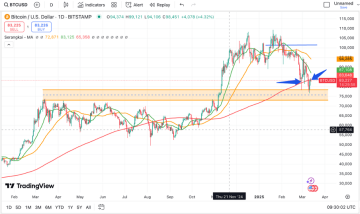
The most important was around $80,000, which roughly coincided with Bitcoin’s 200-day moving average – a long-term trend indicator that many traders watch. Indeed, Bitcoin’s decline paused in the low-$80Ks, suggesting buyers stepped in near that 200-day MA support zone. Another support region is around $74,000, corresponding to an area of multiple past price peaks from last year, which would be the next line of defense if $80K failed.
On the upside, the broken support at $90,000 turned into near-term resistance, and beyond that, the $98,000-$100,000 zone became a major ceiling during any attempted bounces. Notably, ~$98.5K aligns closely with the 50-day moving average, so it’s no surprise that level acted as a formidable resistance during recovery attempts. Essentially, Bitcoin would need to climb back above its 50-day MA to regain a bullish footing, and that didn’t happen in February.

Source: tradingview.com
The orange thin line is the 50day moving price average, the red thin line is the 200day moving average. The arrows indicate where the bearmarket battle is currently taking place. The orange band is support formed from price tops from previous years.
Exchange Flows: Were Investors Accumulating or Selling?
A key question throughout the month was whether investors were buying the dip or running for the exits. Exchange flow data – the movement of coins onto or off of exchanges – provides clues to this behavior. Generally, when large amounts of crypto move off exchanges into wallets, it suggests holders are accumulating (since coins in cold storage are less likely to be sold). Conversely, spikes in coins sent to exchanges may indicate people preparing to sell.
February actually gave mixed signals on this front. Early in the month, there were signs of accumulation: for example, during the second week of February. However, as the month progressed and the market sell-off intensified, the balance appeared to shift. The overall trend in February was net outflows of capital from crypto markets, suggesting caution.

Source: https://www.theblock.co/
In other words, early birds might have been buying, but latecomers in the downturn were largely selling. The net effect? Exchange balances of key coins didn’t drastically shrink despite early accumulation, as many traders moved coins onto exchanges to cut their losses amid the mid-to-late February drop. It was a tug-of-war between dip buyers and fearful sellers – and by the end of the month, the sellers had the upper hand in tilting the flows toward net outflow of investor capital from the crypto space.
On-Chain Activity and DeFi Usage Slowdown:
On-chain metrics and DeFi platform usage reflected the broader risk-off mood. After a bustling January, blockchain activity cooled off in February almost across the board. By various measures, the crypto economy’s digital “heartbeat” slowed: daily revenues from blockchain fees dropped nearly 50%, decentralized exchange (DEX) trading volumes fell about 27%, and stablecoin transfer volumes declined ~16% versus the previous month. Fewer people were chasing on-chain trades, resulting in lower congestion and fees. (Notably, one outlier was Coinbase’s new Layer-2 network Base, which had some isolated bursts of activity; excluding those, the drop in stablecoin transfers was actually much steeper at ~42% month-over-month.)
Importantly, the share of crypto trading happening on decentralized exchanges vs. centralized exchanges dipped slightly, from an all-time high of 20.2% in January down to 19.2% in February
This indicates that when volatility hit, a bit of trading volume shifted back towards centralized exchanges – likely because casual traders preferred the familiar CEX environment during the turbulence, or simply because overall DeFi usage fell off. In essence, the DeFi frenzy took a breather as traders became more conservative.
All told, February 2025 was a month of consolidation – and a reality check – for the crypto market. What goes up fast can come down just as fast. Is this the start of a deeper bear phase or just a healthy pullback within a larger uptrend? It’s always hard to say in the moment. On the one hand there is looming risk of a recession and on the other is crypto-friendly administration in the U.S
